I’ve been tracking SpaceX (SPCX) since before it went public, and I’ve written about nearly every bearish signal that’s emerged.
Doug Kass‘s short thesis, Jim Cramer‘s urge for patience before the lockup expiration, the former Nasdaq CEO‘s lockup warning, and Peter Andersen actively shorting and dismissing the Tesla merger thesis.
My colleagues have also covered Michael Burry walking away from the trade entirely, and prominent veteran investor and former Fidelity manager George Noble labeling SpaceX “one of the best shorts in the market.”
Those are just a few of the signals. Now the chart is telling me the same story the fundamentals have been revealing for weeks. And when technicals and fundamentals align this cleanly, it’s time to pay close attention.
SPCX is trading around $141.50 as of the week ending Aug. 28. That’s 37% below its all-time high of $225.64, hit just four days after the June 12 IPO.
The price crashed from that peak to $104.85 on Aug. 3, the day before SpaceX’s first quarterly earnings as a public company. Yes, the earnings beat triggered a recovery. But here’s the problem: That recovery retraced straight into a wall.
Also Read: SpaceX Latest News and Stories
What the SpaceX chart is showing right now
Let me walk you through exactly what I’m seeing technically, because the setup is cleaner than most.
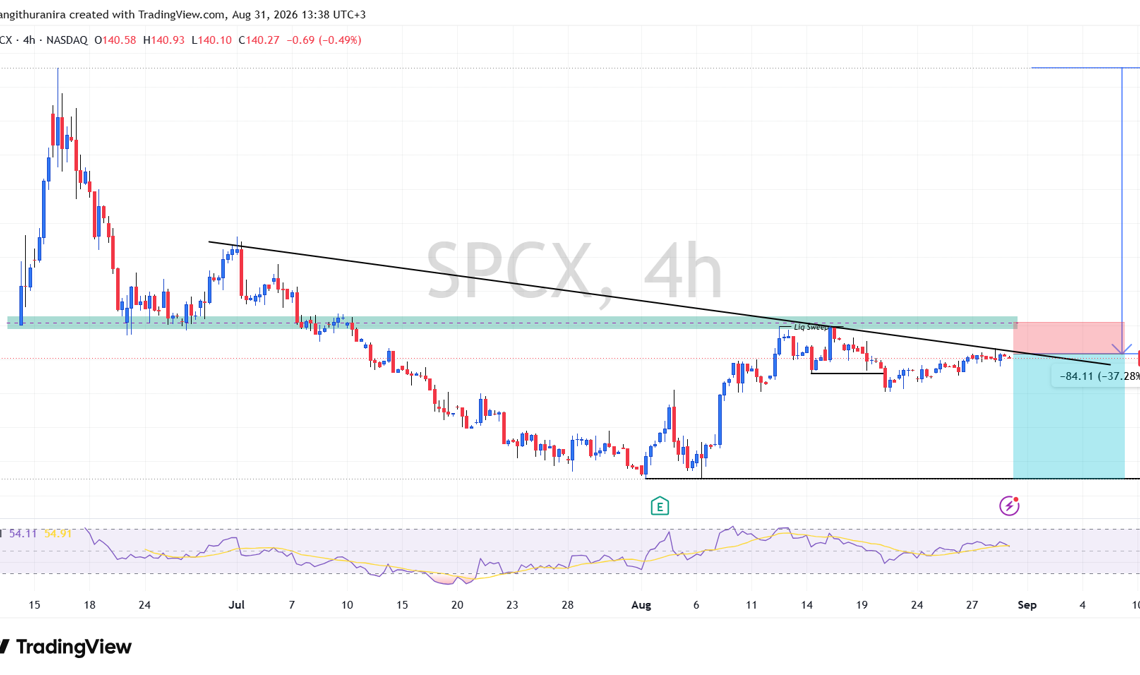
After bottoming near $104.84, price retraced upward and tested a key point of interest (POI) — a resistance zone that has been tested multiple times without being convincingly broken.
At that level, I’m seeing a liquidity sweep followed by a confirmed shift in market structure. The bullish retracement leg has now broken down, signaling that the recovery move is likely complete and the broader downtrend is ready to resume.
Also, a descending trendline already tested twice with clear rejections acts as confluence with the existing bearish thesis.
My current setup is a short entry around the current market price, with a stop-loss at $151 and a target at the $104 sell-side liquidity.
That’s almost a 1:4 risk-reward setup. It is approximately a 25% decline from current levels, bringing total drawdown from the all-time high to roughly 52%.
TradingView
The bearish pressure is building, not dissipating. Every bounce into that support-turned-resistance zone has been met with a rejection.
Until price closes convincingly above $151 on strong volume, the path of least resistance remains lower.
SpaceX fundamental case that backs up the chart
Technical analysis is not the only metric looking strong. The SPCX fundamental picture remains deeply uncomfortable for bulls at current prices.
SpaceX’s Q2 2026 earnings showed $7.8 billion in revenue, up 92% year over year. Sure, that’s a genuine beat versus the Street’s $6.93 billion estimate, according to TheStreet’s reporting. That helped the bullish retracement leg.
More SpaceX:
- Elon Musk’s startling claim to SpaceX investors
- Citi sends powerful sign to SpaceX investors
- Beaten-down stock lets you buy SpaceX below market price
But capital expenditure hit $18.4 billion for the quarter, with $15.8 billion directed toward AI infrastructure buildout, according to SpaceX’s Q2 2026 earnings report. Net loss was $541 million. Free cash flow stayed negative.
The stock fell 13.6% the day after the report, according to TheStreet‘s reporting.
That reaction tells you something important about how sensitive SPCX is to cash burn. Revenue growth isn’t the problem. The spending pace is.
And until investors see a credible path to free cash flow generation beyond Starlink — which generated approximately $1.66 billion in operating profit in Q2 and remains the only profitable segment — the multiple is difficult to justify.
Morningstar analyst Nicolas Owens has a fair value estimate of $62 on SPCX, which he reaffirmed after Q2 earnings, noting shares were trading at roughly twice his valuation. Former Fidelity Overseas Fund manager George Noble, who worked under Peter Lynch, told Business Insider he sees fair value for SpaceX around $30 per share.
George flagged passive index fund flows as a structural concern, noting that retirement savings are being channeled into the stock, regardless of valuation.
Jonathan Raa/NurPhoto via Getty Images
What IPO history says happens next
My chart setup and the fundamental thesis have more confluence. Historical data on large IPOs points in the same bearish direction, too.
Among the 10 largest U.S. IPOs by market value since 2006, the average stock fell 34% from its IPO price at some point during the first year, according to The Motley Fool analysis of data compiled by University of Florida finance professor Jay Ritter.
Applied to SpaceX’s $135 IPO price, that historical pattern implies a drop to approximately $89 per share before June 2027.
The same dataset shows the average large IPO stock trading 12% below its IPO price after the first full year on the market, implying $119 per share for SPCX by June 2027, according to the same Motley Fool analysis.
I covered this dynamic extensively in my earlier SpaceX coverage. The median Year 1 maximum drawdown across major tech IPOs of the last decade was 54%. Facebook fell 54%. Uber dropped 68%. Snowflake lost 52%. SpaceX is already down 37% from its peak. History says there’s more room to go.
Related: Veteran hedge fund manager makes a brazen SpaceX bet
The lockup dynamic continues to add supply pressure. Roughly 911.5 million shares became eligible to trade on Aug. 6, more than doubling the public float from about 639 million to 1.55 billion shares, according to Reuters.
Additional unlock tranches are spread across multiple dates into late 2026. More supply, same demand pool. That math doesn’t favor bulls.
SpaceX long-term case exists, but price matters
I want to be clear about something. I’m not bearish on what SpaceX is building. Starlink has roughly 12 million subscribers and is the only division generating consistent operating profit.
The AI compute rental business, signing agreements with Anthropic, Google, and, as Bloomberg reported, Reflection AI, represents a genuinely interesting long-term revenue stream.
But there’s a massive difference between a great company and a great stock at every price. Peter Andersen, who remains actively short, put it this way when I covered him earlier: At 50 times revenue, and even if everything goes right, “You’re paying a pretty hefty price.”
Morningstar’s $62 fair value. Noble’s $30 target. My own near-term technical analysis points toward $104. These are very different methodologies converging on the same conclusion. The current price doesn’t reflect a reasonable margin of safety for the risks involved.
SPCX closed around $141.50 for the week ending Aug. 28, according to Yahoo Finance. My short setup targets $104.
None of that is a guarantee. But when the chart, the fundamentals, and the historical data all point in the same direction, I think investors deserve to hear it clearly.
Related: JPMorgan doubles down on SpaceX verdict on key update